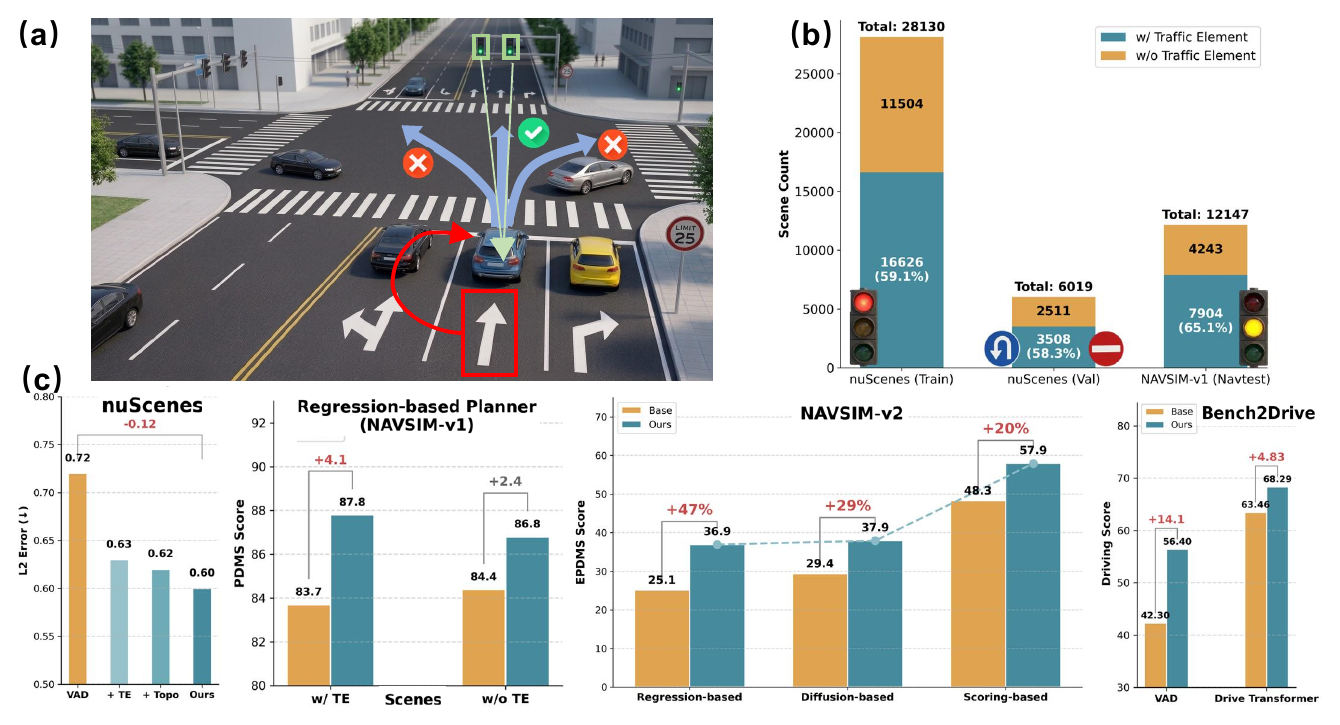
59.1% of nuScenes training scenes, 58.3% of nuScenes validation scenes, and 65.1% of NAVSIM-v1 scenes contain traffic elements.
Motivation
Traffic elements are rule-critical, common, and under-modeled.
End-to-end driving models often emphasize dynamic agents and dense geometry, while traffic lights and road signs directly constrain legal maneuvers. This work builds a unified 3D traffic-element infrastructure and studies whether TE awareness transfers across planners, datasets, and evaluation protocols.
A lightweight 3D TE auxiliary task and optional topology conditioning can be added to existing E2E planners with minimal architecture changes.
The method improves regression, diffusion, scoring, VLM/VLA-style, and perception-planning systems across open-loop and closed-loop benchmarks.
Perception-planningVAD and classical E2E systems on nuScenes / Bench2Drive.
VLM / VLAOrion-style vision-language-action planning.
RegressionLTF-style direct trajectory regression.
DiffusionDiffusionDrive-style generative planning.
ScoringDrivoR-style trajectory proposal and ranking.
Closed-loopCARLA Bench2Drive evaluation with real planner rollouts.
Method
Lift traffic elements into 3D, then route them into planning.
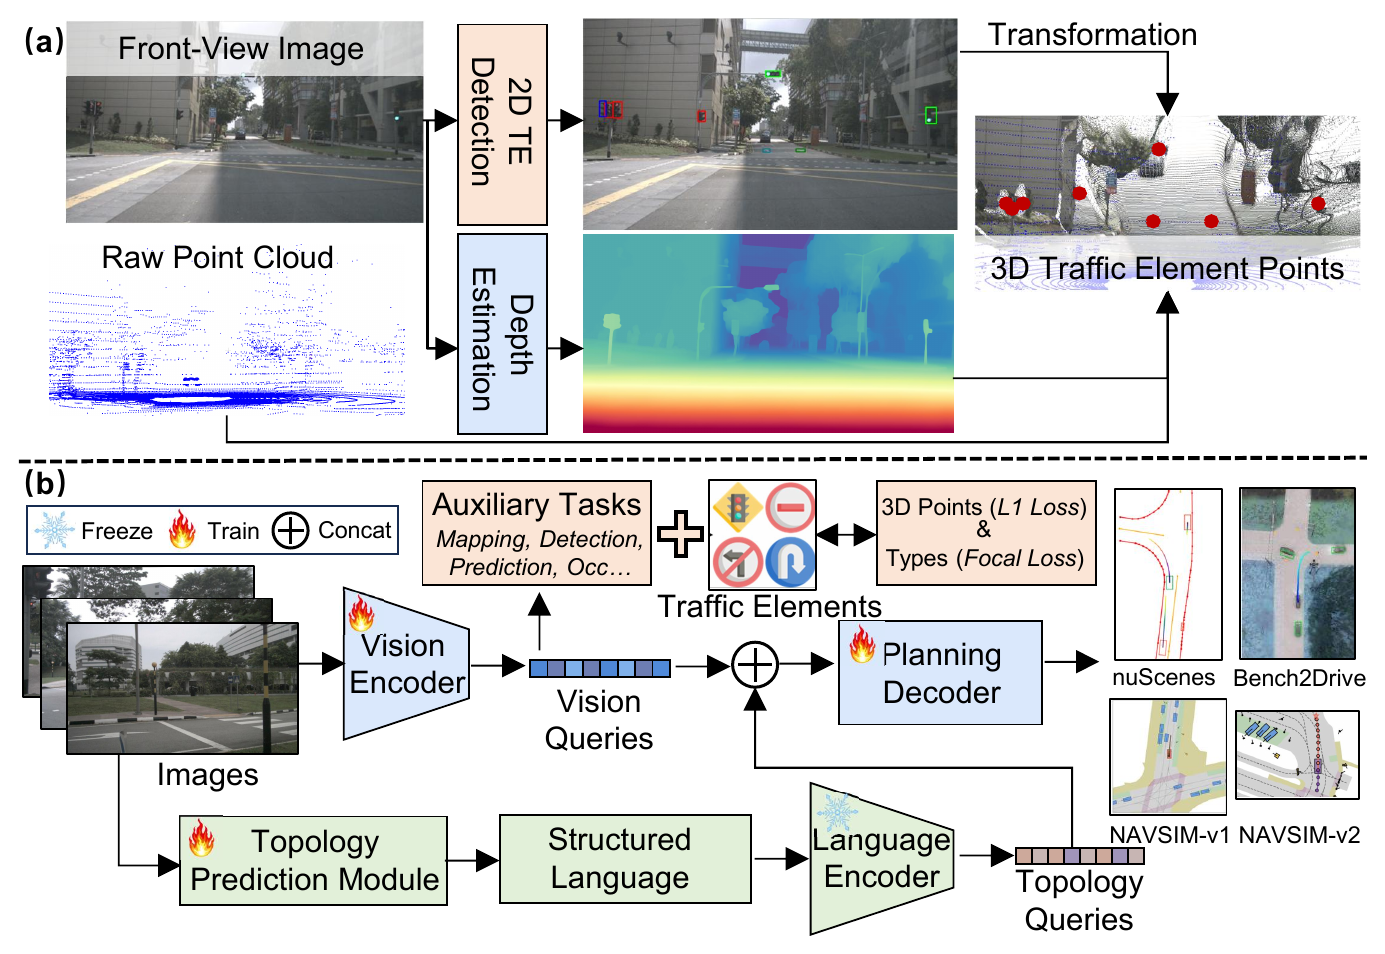
The pipeline first constructs 3D traffic-element pseudo-labels from 2D detection, monocular depth, and LiDAR geometry. During planner training, TE supervision encourages BEV or vision queries to encode sparse but decision-critical rule cues. When topology is available, ego-centric lane and TE relations are encoded as structured language and fused into the planning decoder.
1
Construct 3D traffic elements
Combine front-view TE detection, depth estimation, camera calibration, and LiDAR evidence to obtain 3D TE center points.
2
Add lightweight TE supervision
Supervise TE location with L1 loss and category with focal loss, alongside the planner's original auxiliary tasks.
3
Filter ego-relevant topology
Use LCLC and LCTE relations to keep the centerlines and traffic elements that actually govern the ego lane.
4
Condition the planning decoder
Encode topology as structured language and concatenate topology queries with TE-enhanced BEV or vision queries.
Main Experiments
Stable improvements across multiple end-to-end driving paradigms.
The main results show that traffic-element awareness improves trajectory accuracy, rule compliance, and closed-loop driving score across perception-planning, VLM/VLA, regression-based, diffusion-based, and scoring-based planners. The project page reports the primary experimental results only; ablation studies are intentionally omitted.
nuScenes Planning L2 and collision rate lower are better; FPS higher is better
Caption. nuScenes compares LiDAR-based methods, camera-based E2E planners, and VLM/VLA-style planners under the standard open-loop protocol. Highlighted rows isolate the plug-and-play traffic-element and topology signals, showing consistent gains for both VAD and Orion.
| Method | Auxiliary Task | L2 (m) ↓ | Collision Rate (%) ↓ | FPS ↑ | ||||||
|---|---|---|---|---|---|---|---|---|---|---|
| 1s | 2s | 3s | Avg. | 1s | 2s | 3s | Avg. | |||
| LiDAR-based Methods | ||||||||||
| NMP◇ | Det + Motion | 0.53 | 1.25 | 2.67 | 1.48 | 0.04 | 0.12 | 0.87 | 0.34 | — |
| FF◇ | FreeSpace | 0.55 | 1.20 | 2.54 | 1.43 | 0.06 | 0.17 | 1.07 | 0.43 | — |
| EO◇ | FreeSpace | 0.67 | 1.36 | 2.78 | 1.60 | 0.04 | 0.09 | 0.88 | 0.33 | — |
| Camera-based End-to-End Planning Methods | ||||||||||
| ST-P3 | Det + Map + Depth | 1.33 | 2.11 | 2.90 | 2.11 | 0.23 | 0.62 | 1.27 | 0.71 | 1.6 |
| UniAD | Det + Track + Map + Motion + Occ | 0.44 | 0.67 | 0.96 | 0.69 | 0.04 | 0.08 | 0.23 | 0.12 | 1.8 |
| VAD-Tiny | Det + Map + Motion | 0.46 | 0.76 | 1.12 | 0.78 | 0.21 | 0.35 | 0.58 | 0.38 | 16.8 |
| BEV-Planner | None | 0.28 | 0.42 | 0.68 | 0.46 | 0.04 | 0.37 | 1.07 | 0.49 | — |
| PARA-Drive | Det + Track + Map + Motion + Occ | 0.25 | 0.46 | 0.74 | 0.48 | 0.14 | 0.23 | 0.39 | 0.25 | 5.0 |
| LAW | None | 0.26 | 0.57 | 1.01 | 0.61 | 0.14 | 0.21 | 0.54 | 0.30 | 19.5 |
| GenAD | Det + Map + Motion | 0.28 | 0.49 | 0.78 | 0.52 | 0.08 | 0.14 | 0.34 | 0.19 | 6.7 |
| SparseDrive | Det + Track + Map + Motion | 0.29 | 0.58 | 0.96 | 0.61 | 0.01 | 0.05 | 0.18 | 0.08 | 9.0 |
| UAD | Det | 0.28 | 0.41 | 0.65 | 0.45 | 0.01 | 0.03 | 0.14 | 0.06 | 7.2 |
| MomAD | Det + Track + Map + Motion | 0.31 | 0.57 | 0.91 | 0.60 | 0.01 | 0.05 | 0.22 | 0.09 | 7.8 |
| Perception-planning Baseline with TE / Topology | ||||||||||
| VAD-Base | Det + Map + Motion | 0.41 | 0.70 | 1.05 | 0.72 | 0.07 | 0.17 | 0.41 | 0.22 | 5.7 |
| VAD + TE | Det + Map + Motion | 0.36 | 0.61 | 0.92 | 0.63 | 0.09 | 0.14 | 0.28 | 0.17 | 5.7 |
| VAD + Topo | Det + Map + Motion + Topo | 0.34 | 0.59 | 0.92 | 0.62 | 0.05 | 0.15 | 0.29 | 0.16 | 5.4 |
| VAD + Ours | Det + Map + Motion + Topo | 0.34 | 0.56 | 0.90 | 0.60 | 0.04 | 0.21 | 0.26 | 0.17 | 5.4 |
| VLM / VLA-based Methods | ||||||||||
| Qwen-2.5-VL | Scene Understanding | 0.46 | 1.33 | 2.55 | 1.45 | — | — | — | — | 0.8 |
| Senna | Det + Motion | 0.37 | 0.54 | 0.86 | 0.59 | 0.09 | 0.12 | 0.33 | 0.18 | 1.6 |
| DriveVLM | Scene Understanding | 0.18 | 0.34 | 0.68 | 0.40 | 0.10 | 0.22 | 0.45 | 0.27 | — |
| OmniDrive | Scene Understanding | 0.14 | 0.29 | 0.55 | 0.33 | 0.00 | 0.13 | 0.78 | 0.30 | 1.2 |
| EMMA | Scene Understanding | 0.14 | 0.29 | 0.54 | 0.32 | — | — | — | — | — |
| ImpromptuVLA | Scene Understanding | 0.13 | 0.27 | 0.53 | 0.30 | — | — | — | — | 0.9 |
| Orion† | Det + Motion | 0.17 | 0.31 | 0.55 | 0.34 | 0.05 | 0.25 | 0.80 | 0.37 | 0.9 |
| Orion† + TE | Det + Motion | 0.14 | 0.27 | 0.47 | 0.29 | 0.06 | 0.20 | 0.55 | 0.27 | 0.9 |
| Orion† + Topo | Det + Motion + Topo | 0.12 | 0.25 | 0.45 | 0.27 | 0.04 | 0.21 | 0.50 | 0.25 | 0.8 |
| Orion† + Ours | Det + Motion + Topo | 0.11 | 0.25 | 0.43 | 0.26 | 0.04 | 0.19 | 0.47 | 0.23 | 0.8 |
NAVSIM-v1 navtest Camera-only methods; all metrics higher are better
Caption. NAVSIM-v1 reports the official PDMS and its safety/compliance components. The table keeps the paper's method taxonomy and shows that TE supervision improves regression-based, diffusion-based, and scoring-based planners, with further gains when combined with SimScale data.
| Method | Backbone | Venue | NC ↑ | DAC ↑ | TTC ↑ | Comf. ↑ | EP ↑ | PDMS ↑ |
|---|---|---|---|---|---|---|---|---|
| Reference / Rule-based Upper Context | ||||||||
| PDM-Closed | — | PMLR'23 | 94.6 | 99.8 | 89.9 | 86.9 | 99.9 | 89.1 |
| Human driver | — | NeurIPS'24 | 100 | 100 | 100 | 99.9 | 87.5 | 94.8 |
| Published Camera-only E2E Methods | ||||||||
| Ego-stat. MLP | — | NeurIPS'24 | 93.0 | 77.3 | 83.6 | 100 | 62.8 | 65.6 |
| UniAD | ResNet34 | CVPR'23 | 97.8 | 91.9 | 92.9 | 100 | 78.8 | 83.4 |
| VAD-v2 | ResNet34 | ICLR'26 | 98.1 | 94.8 | 94.3 | 100 | 80.6 | 86.2 |
| ReCogDrive | InternViT | ICLR'26 | 97.9 | 97.3 | 94.9 | 100 | 87.3 | 90.8 |
| Hydra-MDP | ResNet34 | arXiv'24 | 98.3 | 96.0 | 94.6 | 100 | 78.7 | 86.5 |
| Centaur | ResNet34 | arXiv'25 | 99.5 | 98.9 | 98.0 | 100 | 85.9 | 92.6 |
| DriveSuprim | ResNet34 | AAAI'26 | 97.8 | 97.3 | 93.6 | 100 | 86.7 | 89.9 |
| Regression-based Planner | ||||||||
| LTF | ResNet34 | TPAMI'22 | 97.8 | 92.8 | 93.3 | 100 | 78.9 | 84.1 |
| LTF + Ours | ResNet34 | ECCV'26 | 97.8 | 93.9 | 93.8 | 100 | 79.8 | 85.2 +1.1 |
| LTF (+SimScale) | ResNet34 | ECCV'26 | 98.3 | 95.6 | 94.6 | 100 | 81.3 | 87.3 +3.2 |
| LTF (+SimScale) + Ours | ResNet34 | ECCV'26 | 98.2 | 95.9 | 94.5 | 100 | 82.0 | 87.6 +3.5 |
| Diffusion-based Planner | ||||||||
| DiffusionDrive | ResNet34 | CVPR'25 | 97.9 | 94.6 | 93.6 | 100 | 80.7 | 86.0 |
| DiffusionDrive + Ours | ResNet34 | ECCV'26 | 98.1 | 96.0 | 94.2 | 100 | 82.3 | 87.7 +1.7 |
| DiffusionDrive (+SimScale) | ResNet34 | ECCV'26 | 98.5 | 97.0 | 94.7 | 100 | 83.1 | 88.9 +2.9 |
| DiffusionDrive (+SimScale) + Ours | ResNet34 | ECCV'26 | 98.6 | 97.2 | 94.7 | 100 | 83.5 | 89.1 +3.1 |
| Scoring-based Planner | ||||||||
| DrivoR | ViT-S | CVPR'26 | 98.9 | 98.3 | 96.2 | 100 | 89.1 | 93.1 |
| DrivoR + Ours | ViT-S | ECCV'26 | 99.0 | 98.7 | 96.9 | 100 | 90.8 | 94.4 +1.3 |
| DrivoR (+SimScale) | ViT-S | ECCV'26 | 99.1 | 99.2 | 96.9 | 100 | 91.6 | 94.6 +1.5 |
| DrivoR (+SimScale) + Ours | ViT-S | ECCV'26 | 99.7 | 99.7 | 98.1 | 100 | 92.2 | 95.1 +2.0 |
NAVSIM-v2 navhard-two-stage All Stage 1/Stage 2 metrics and EPDMS higher are better
Caption. NAVSIM-v2 uses the harder two-stage EPDMS evaluation, exposing compounding-error effects. The grouped rows follow the paper and highlight that traffic-element awareness improves three different planning paradigms: regression (+47%), diffusion (+29%), and scoring (+20%) in the strongest data-scaled settings.
| Method | Stage 1 | Stage 2 | EPDMS ↑ | ||||||||||||||||
|---|---|---|---|---|---|---|---|---|---|---|---|---|---|---|---|---|---|---|---|
| NC | DAC | DDC | TLC | EP | TTC | LK | HC | EC | NC | DAC | DDC | TLC | EP | TTC | LK | HC | EC | ||
| Existing Methods | |||||||||||||||||||
| ZTRS† | 98.9 | 97.6 | 100 | 100 | 66.7 | 98.9 | 96.2 | 96.7 | 44.0 | 91.1 | 90.4 | 95.8 | 99.0 | 63.6 | 89.8 | 60.4 | 97.6 | 66.1 | 45.5 |
| DiffVLA† | 95.7 | 99.2 | 100 | 100 | 85.9 | 96.4 | 97.1 | 95.0 | 84.2 | 81.2 | 88.8 | 94.6 | 99.0 | 86.0 | 76.4 | 59.8 | 98.6 | 80.4 | 45.0 |
| GTRS-Dense† | 98.9 | 94.9 | 99.1 | 100 | 76.1 | 98.4 | 93.8 | 94.9 | 37.8 | 89.9 | 90.5 | 94.1 | 99.3 | 77.6 | 88.5 | 56.0 | 92.0 | 30.2 | 41.9 |
| GuideFlow† | 97.8 | 97.1 | 100 | 100 | 81.4 | 98.5 | 91.4 | 92.8 | 34.2 | 87.3 | 92.3 | 98.0 | 96.9 | 75.8 | 85.5 | 59.3 | 95.4 | 53.5 | 46.7 |
| Regression-based Planner | |||||||||||||||||||
| LTF | 96.2 | 79.5 | 99.1 | 99.5 | 84.1 | 95.1 | 94.2 | 97.5 | 79.1 | 77.7 | 70.2 | 84.2 | 98.0 | 85.1 | 75.6 | 45.4 | 95.7 | 75.9 | 25.1 |
| LTF + Ours | 96.4 | 79.8 | 98.9 | 99.6 | 84.2 | 95.8 | 93.8 | 97.5 | 78.2 | 80.9 | 71.6 | 84.8 | 98.9 | 85.2 | 77.7 | 47.0 | 96.1 | 76.3 | 28.9 ↑15% |
| LTF (+SimScale) | 96.1 | 85.3 | 99.4 | 99.3 | 84.7 | 94.7 | 93.5 | 97.5 | 77.3 | 85.5 | 66.9 | 91.5 | 99.1 | 93.0 | 81.1 | 58.2 | 95.1 | 42.9 | 33.6 ↑33% |
| LTF (+SimScale) + Ours | 97.0 | 85.3 | 99.7 | 99.6 | 84.2 | 96.2 | 96.0 | 97.6 | 77.3 | 88.1 | 71.8 | 93.1 | 99.0 | 86.7 | 83.0 | 54.0 | 95.2 | 55.4 | 36.9 ↑47% |
| Diffusion-based Planner | |||||||||||||||||||
| DiffusionDrive | 96.7 | 86.7 | 98.7 | 99.3 | 84.3 | 94.9 | 95.3 | 97.6 | 77.8 | 78.9 | 72.4 | 84.2 | 98.2 | 87.1 | 74.9 | 47.3 | 96.2 | 71.0 | 29.4 |
| DiffusionDrive + Ours | 97.1 | 86.9 | 98.8 | 99.6 | 84.2 | 95.1 | 95.6 | 97.6 | 79.5 | 80.2 | 74.0 | 85.0 | 98.1 | 86.3 | 77.2 | 48.4 | 96.6 | 74.4 | 32.7 ↑11% |
| DiffusionDrive (+SimScale) | 97.2 | 88.0 | 99.2 | 99.3 | 82.8 | 96.7 | 98.0 | 97.5 | 58.2 | 86.7 | 72.1 | 93.0 | 98.8 | 92.1 | 80.6 | 61.1 | 95.3 | 33.1 | 35.8 ↑12% |
| DiffusionDrive (+SimScale) + Ours | 97.1 | 88.4 | 99.3 | 99.3 | 84.1 | 95.6 | 98.2 | 97.6 | 72.9 | 83.7 | 76.3 | 92.5 | 98.9 | 90.3 | 78.9 | 57.7 | 94.4 | 56.1 | 37.9 ↑29% |
| Scoring-based Planner | |||||||||||||||||||
| DrivoR | 98.8 | 95.1 | 98.9 | 100 | 72.6 | 98.7 | 94.0 | 97.6 | 73.3 | 90.2 | 88.4 | 91.9 | 98.6 | 70.0 | 88.0 | 50.1 | 98.5 | 76.2 | 48.3 |
| DrivoR + Ours | 98.9 | 94.9 | 99.1 | 100 | 75.1 | 98.9 | 93.9 | 97.5 | 74.4 | 91.9 | 91.4 | 96.1 | 99.3 | 74.6 | 87.5 | 56.0 | 97.0 | 78.5 | 51.8 ↑7.2% |
| DrivoR (+SimScale) | 99.1 | 98.2 | 99.3 | 99.8 | 75.4 | 98.7 | 94.9 | 97.6 | 70.2 | 92.3 | 91.6 | 97.3 | 99.1 | 75.7 | 90.6 | 56.1 | 98.4 | 44.7 | 54.6 ↑13% |
| DrivoR (+SimScale) + Ours | 99.5 | 98.2 | 99.3 | 100 | 76.1 | 99.0 | 94.1 | 97.9 | 72.6 | 93.5 | 91.8 | 97.0 | 99.3 | 76.6 | 90.9 | 56.0 | 98.0 | 55.6 | 57.9 ↑20% |
Bench2Drive Closed-Loop Planning Driving score higher is better, Avg. L2 lower is better
Caption. Bench2Drive evaluates planners in CARLA closed loop. Adding TE awareness and topology improves both VAD and DriveTransformer-Large on Driving Score and Success Rate with only small latency changes, demonstrating that the signal transfers beyond open-loop prediction.
| Method | Avg. L2 ↓ | Driving Score ↑ | Success Rate (%) ↑ | Efficiency ↑ | Comfortness ↑ | Latency |
|---|---|---|---|---|---|---|
| Expert-feature Distillation Baselines | ||||||
| TCP* | 1.70 | 40.70 | 15.00 | 54.26 | 47.80 | 86 ms |
| TCP-ctrl* | — | 30.47 | 7.27 | 55.97 | 51.51 | 86 ms |
| TCP-traj* | 1.70 | 59.90 | 30.00 | 76.54 | 18.08 | 86 ms |
| TCP-traj w/o distillation | 1.96 | 49.30 | 20.45 | 78.78 | 22.96 | 86 ms |
| ThinkTwice* | 0.95 | 62.44 | 31.23 | 69.33 | 16.22 | 698 ms |
| DriveAdapter* | 1.01 | 64.22 | 33.08 | 70.22 | 16.01 | 958 ms |
| General E2E Baselines | ||||||
| AD-MLP | 3.64 | 18.05 | 0.00 | 48.45 | 22.63 | 4.7 ms |
| UniAD-Tiny | 0.80 | 40.73 | 13.18 | 123.92 | 47.04 | 400.3 ms |
| UniAD-Base | 0.73 | 45.81 | 16.36 | 129.21 | 43.58 | 692.6 ms |
| Closed-loop TE / Topology Integrations | ||||||
| VAD | 0.91 | 42.30 | 15.00 | 157.94 | 46.01 | 278.3 ms |
| VAD + Ours | 0.75 -0.16 | 56.40 +14.1 | 21.30 | 125.64 | 48.02 | 282.5 ms |
| DriveTransformer-Large | 0.62 | 63.46 | 35.01 | 100.64 | 20.78 | 211.7 ms |
| DriveTransformer-Large + Ours | 0.57 -0.05 | 68.29 +4.83 | 39.61 | 82.45 | 23.58 | 216.5 ms |
Qualitative Visualizations
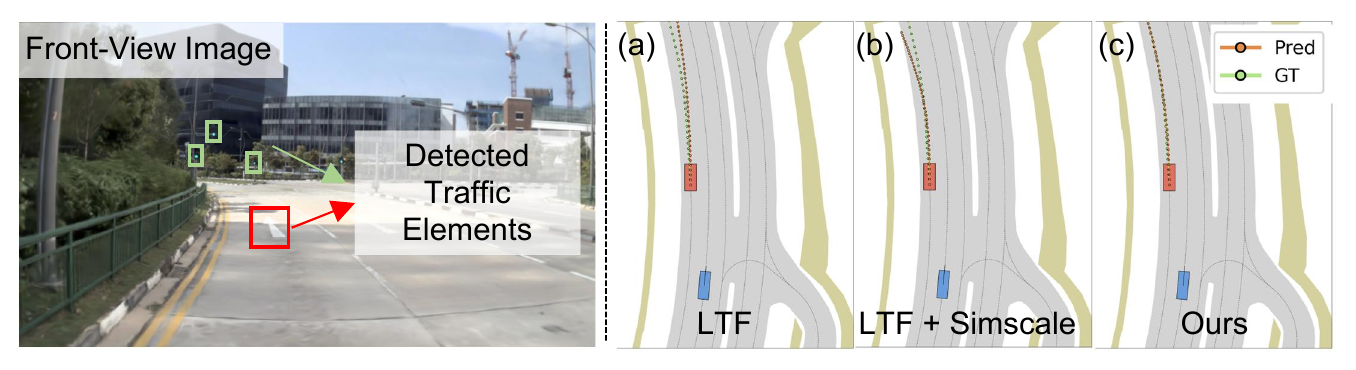
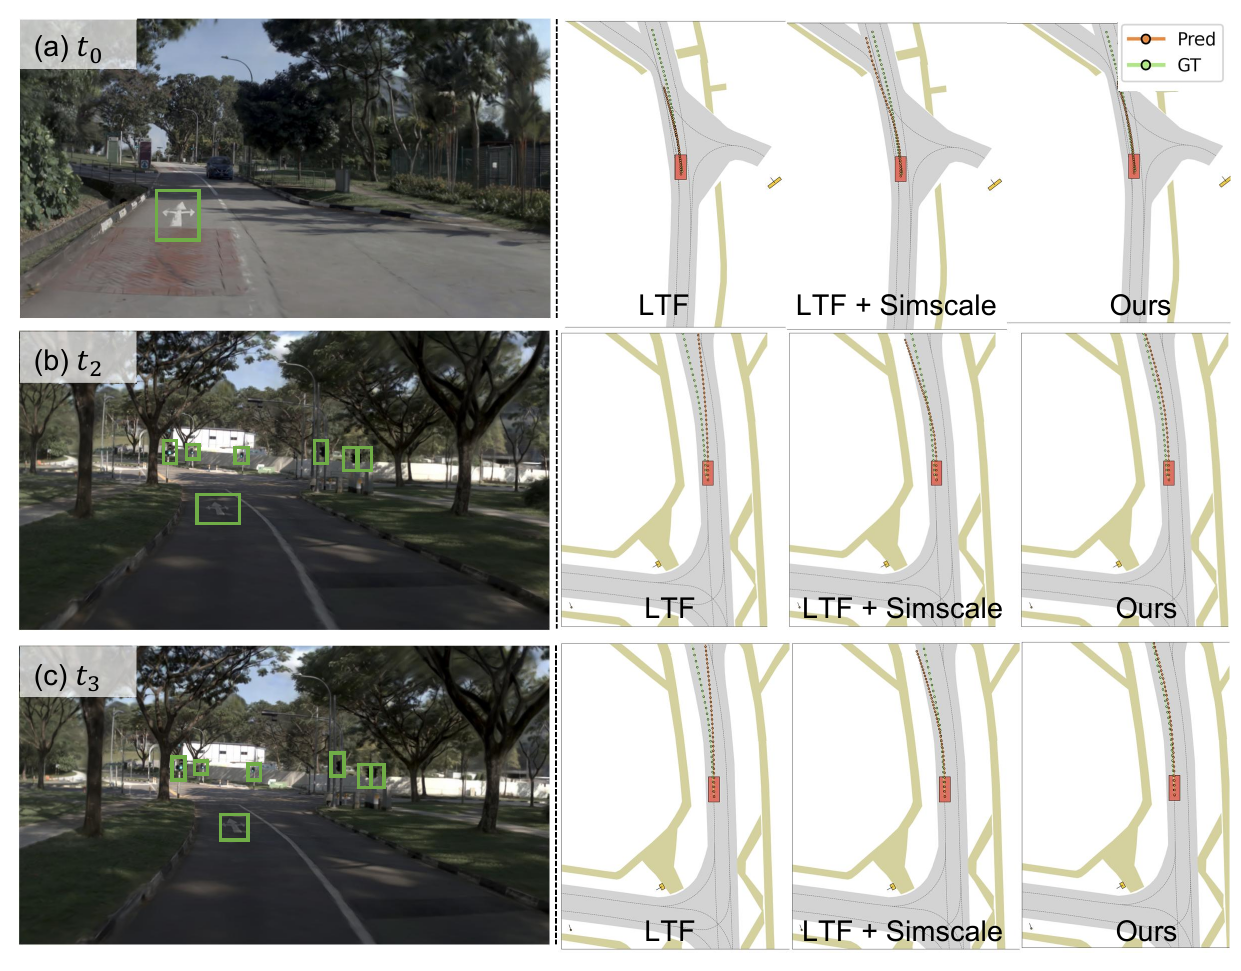
Traffic elements change the planned behavior, not just the score.
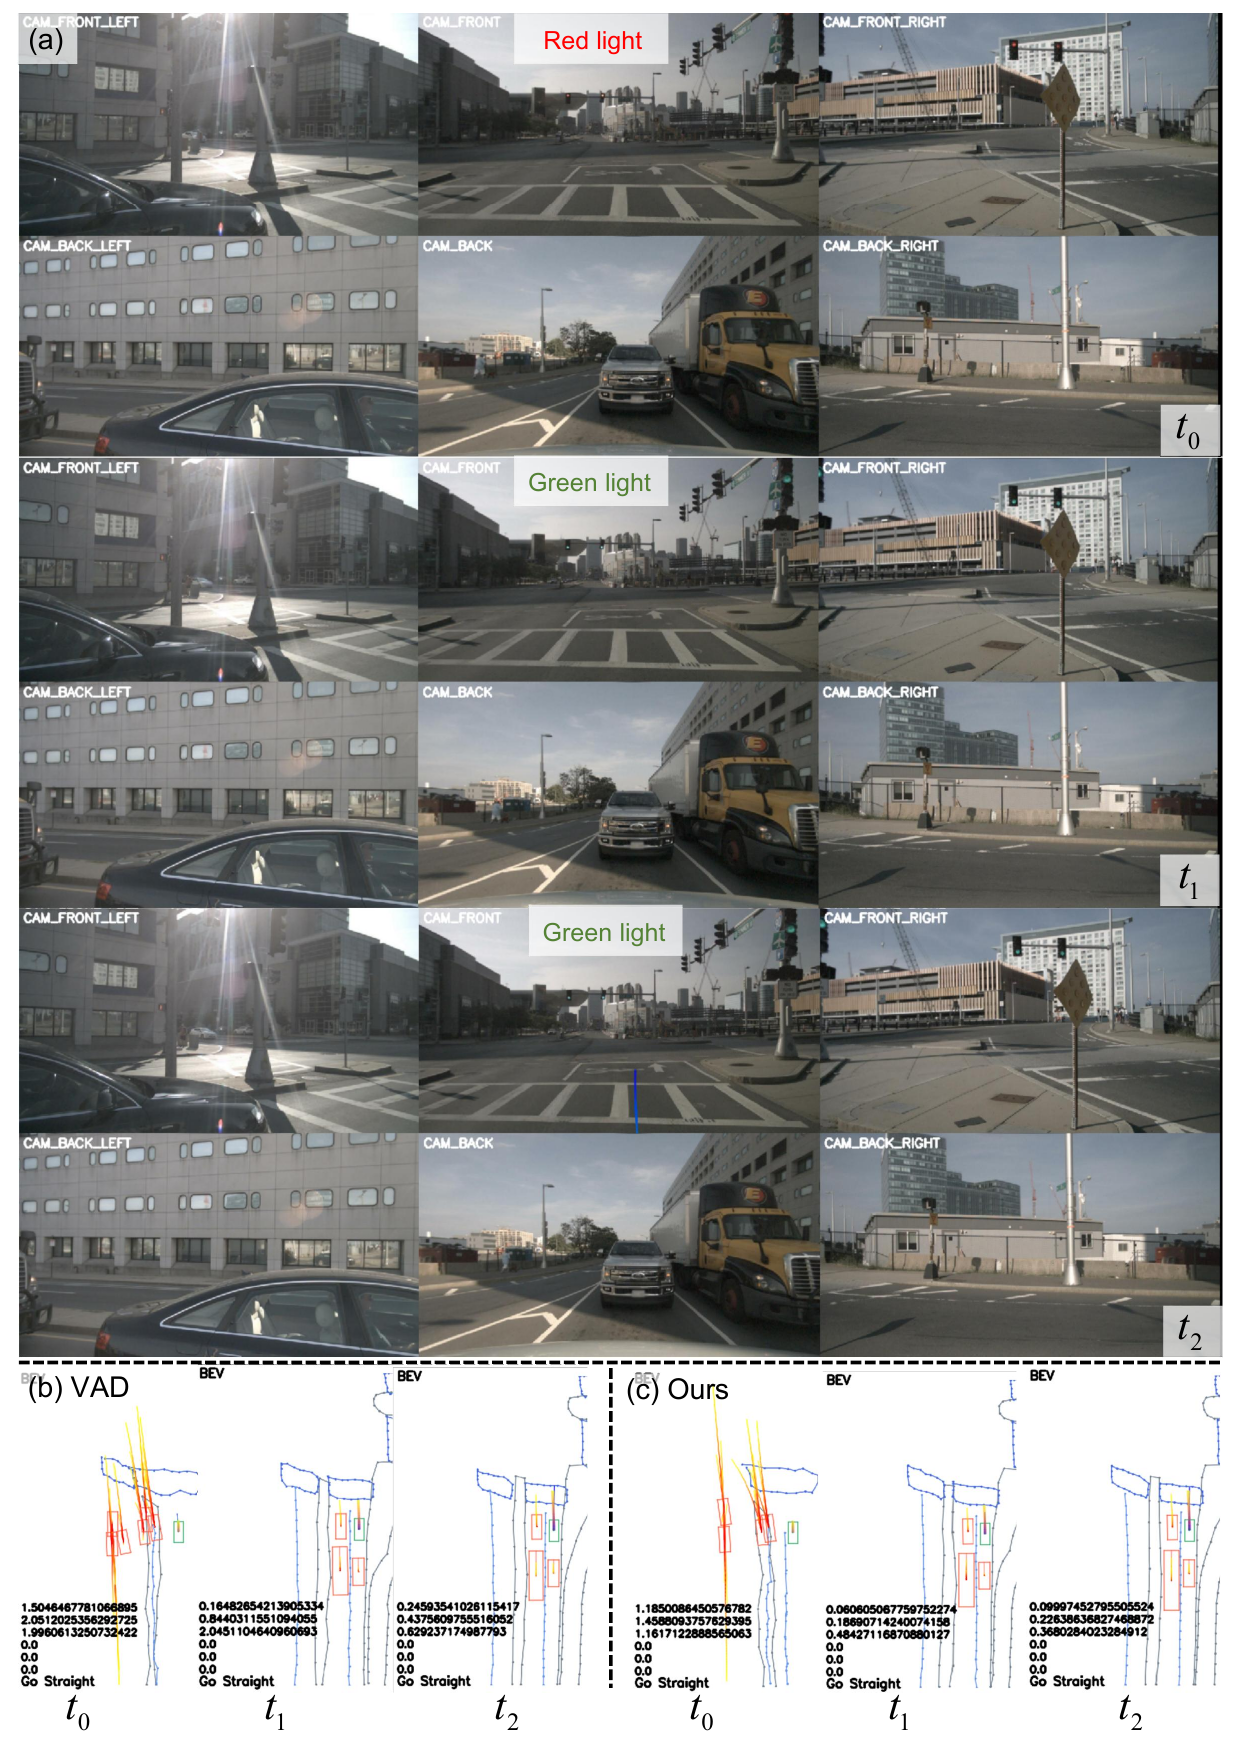
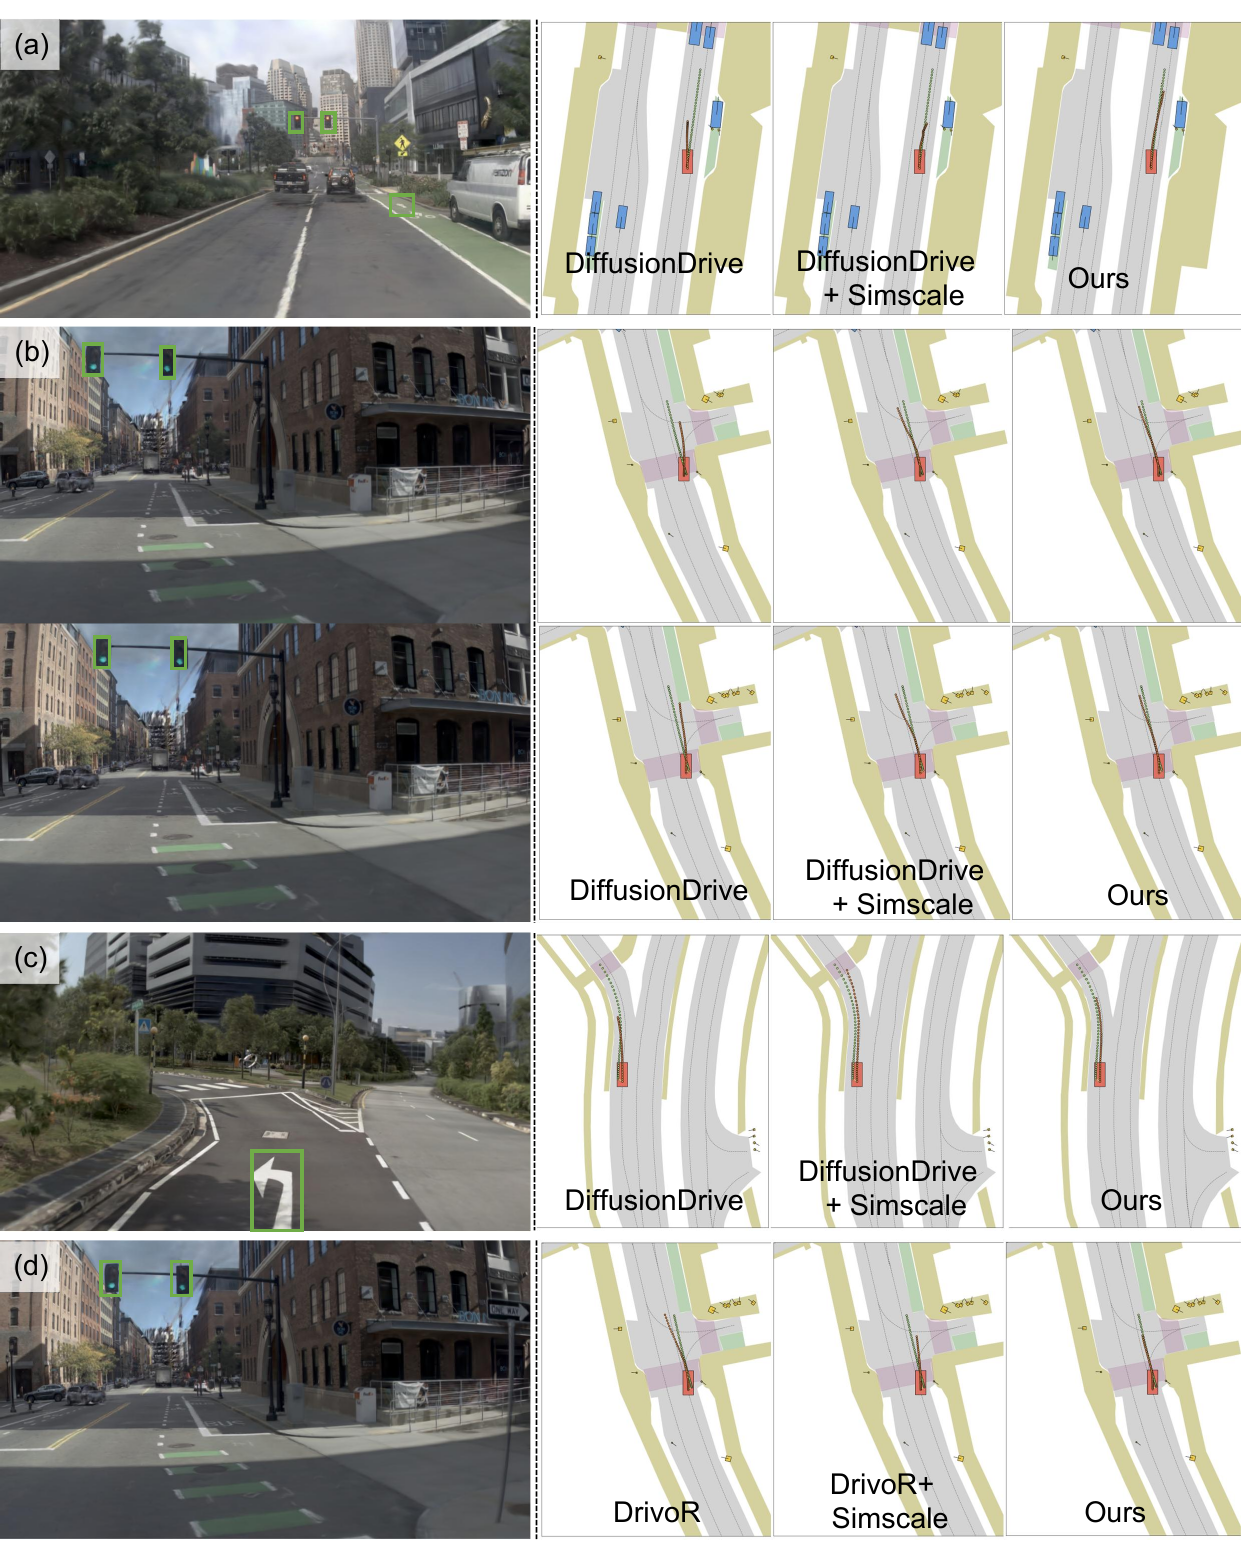
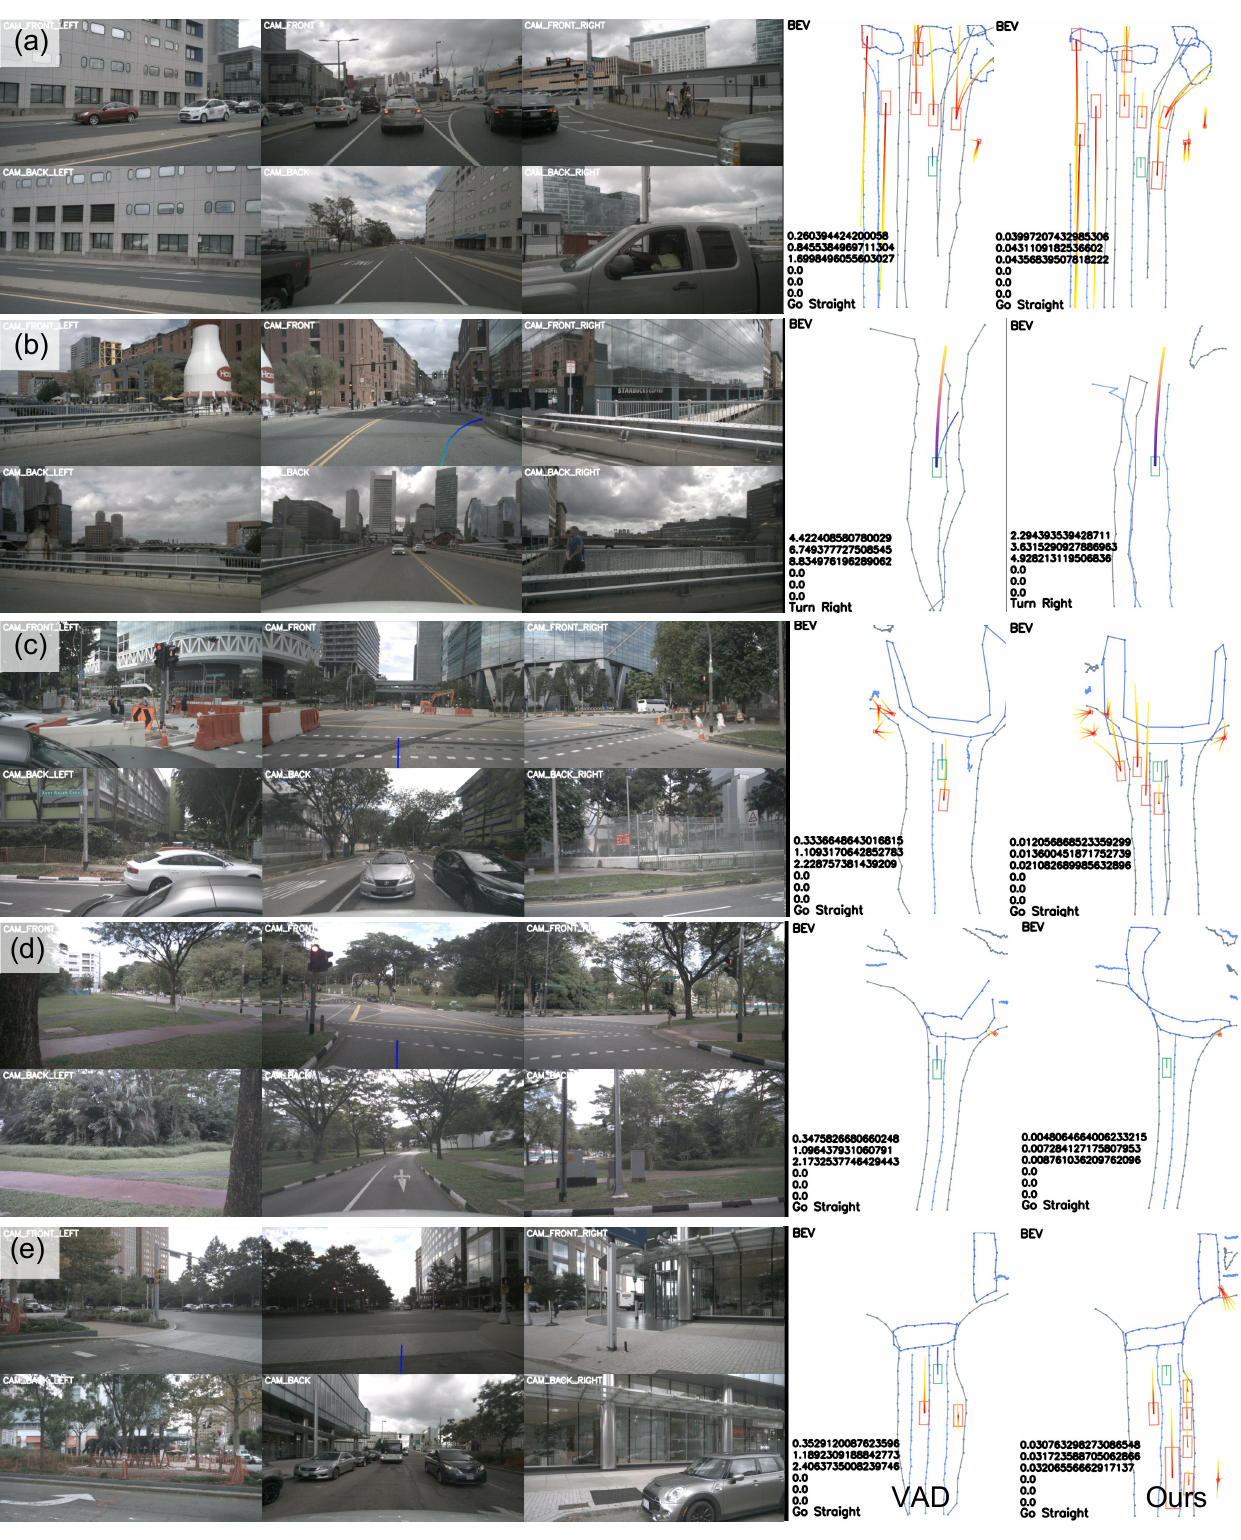
We show how TE-aware planners behave in traffic-element-rich intersections, time-varying light states, and synthetic NAVSIM-v2 scenes across different planning paradigms.
Citation
BibTeX
Please cite this work if the traffic-element annotations, plug-and-play TE supervision, or topology-conditioning design are useful for your research.
@article{zhang2026plug,
  title={Plug-and-Play Traffic Element Awareness for End-to-End Autonomous Driving},
  author={Zhang, Zongzheng and Wang, Jijun and Zhang, Saining and Wang, Shuo and Wang, Yiru and Yang, Hai and Chen, Yang and Heng, Yuwen and Sun, Hao and Jiang, Anqing and others},
  journal={arXiv preprint arXiv:2608.18035},
  year={2026}
}